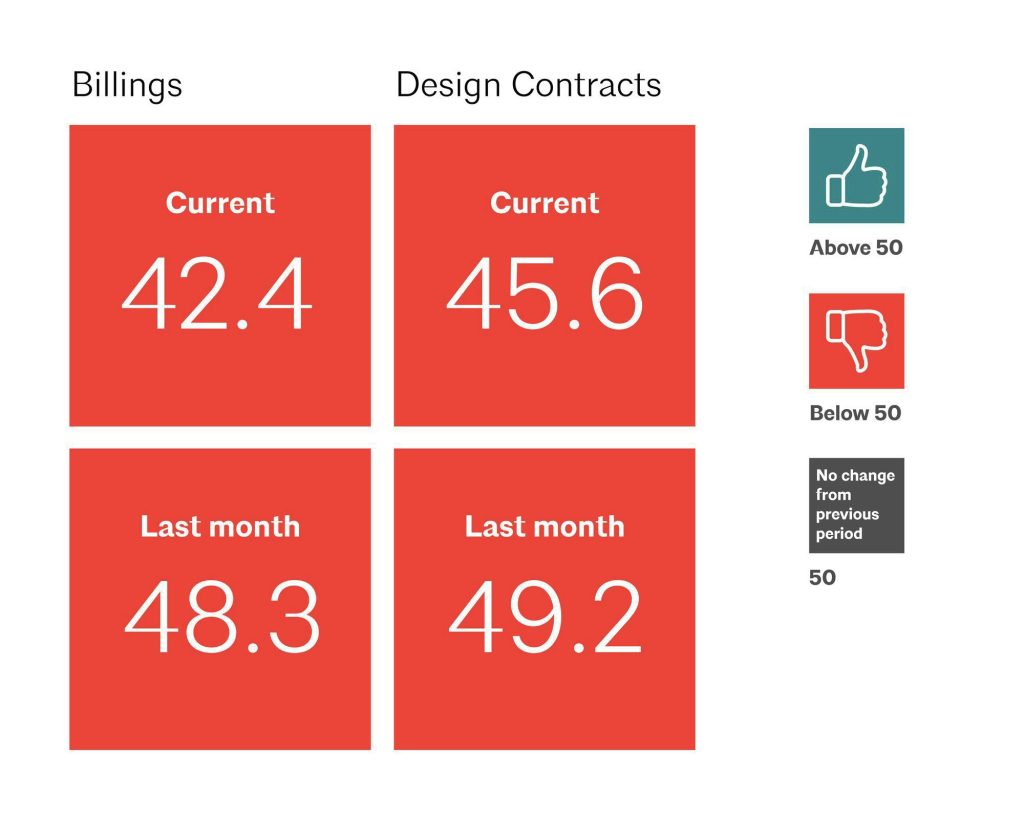
In a recent assessment by the American Institute of Architects (AIA) and Deltek, the Architecture Billings Index (ABI) for May recorded a significant drop to 42.4, marking a continued decline in architectural billings in the U.S., which signals broader economic challenges ahead.
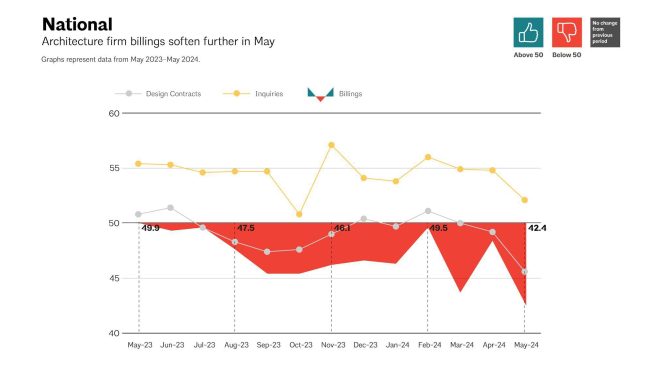
Kermit Baker, PhD, AIA Chief Economist, highlighted the extended period of difficulty that has been affecting the industry. “The decline in the May ABI score continues a year and a half of weakness in design billings at U.S. architecture firms. However, firms only reported modest declines over the first half of this period,” Baker explained. He also noted that the volatility has escalated over the last nine months, with May’s score being the weakest since the end of the pandemic recession
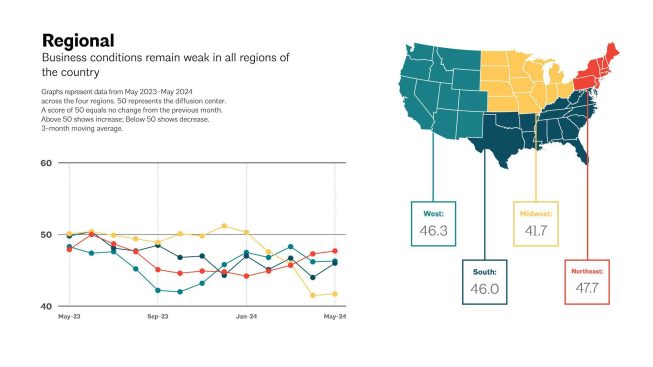
The report also noted an increasing softness in the pipeline of new work coming into firms. While inquiries into new projects continue to grow, the pace has slowed down compared to recent months. This softness was consistent across all regions and sectors in May, with billings falling for the fourth consecutive month in every U.S. region. The Midwest, in particular, experienced the weakest conditions.
The ABI, recognized as a leading economic indicator of construction activity, provides insights into nonresidential construction spending approximately nine to twelve months in advance. This index is derived from a monthly survey of architecture firms that measures the change in the volume of services provided to clients.
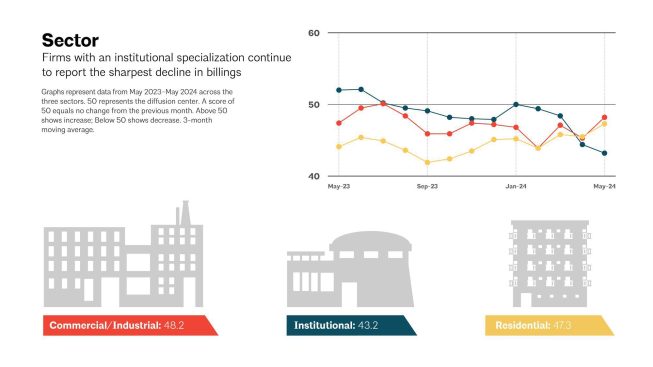
May’s key ABI highlights showed variability across different regions and sectors:
• Regional averages were: Northeast (47.7), Midwest (41.7), South (46.0), West (46.3).
• Sector index breakdown showed commercial/industrial at 48.2, institutional at 43.2, mixed practice (firms that do not have at least half of their billings in any one other category) at 42.8, and multifamily residential at 47.3.
• Project inquiries index stood at 52.1, with the design contracts index slightly lower at 45.6.
These regional and sector indices, calculated as three-month moving averages, provide a snapshot of the disparities that do not always align with the national score.
Visit AIA’s website for detailed information about this, and past billing index reports.