Just when a client is moving into a building, their architects are often on the way out with limited or zero responsibility, time, or budget to monitor project performance and success. But a forthcoming app by KieranTimberlake aims to shift this paradigm, enabling designers to conduct and analyze post-occupancy evaluations in a streamlined manner.
In a couple of months, the Philadelphia architectural design, planning, and research firm and its affiliate KT Innovations expect to release Roast for external beta-testing. The cloud-based survey app will allow “anyone who is in space and in time to report how they feel in their space,” says partner Billie Faircloth, AIA, who also oversaw the firm’s creation of Tally, a lifecycle tracking plugin for Autodesk Revit, and Pointelist, a wireless sensor network for monitoring building conditions.
With a building management system and more than 300 Pointelist sensors tracking the conditions of the KieranTimberlake’s own 63,000-square-foot office, Faircloth says the firm “recognized the need to get feedback from—and I’m not trying to dehumanize this—our bodies as sensors.” How people, she says, respond to heat and cold, and humid or dry air are also “data points that are just as important—if not more—as getting temperature and relative humidity in real time.”
Every space, she says, is designed with “a hypothesis, either articulated or not” on what it should feel like and what it should do. Measuring outcomes becomes particularly crucial for architects conducting a specific design study on, say, visual comfort or underfloor HVAC delivery to assess how their decisions have panned out.
KT Innovations
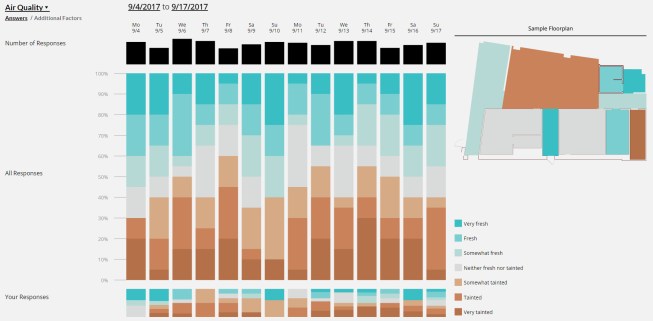
Sample graphic showing Roast survey responses about air quality
What distinguishes Roast from existing digital survey tools, such as SurveyMonkey, is its ability to map responses to the space in which the respondent is located, down to their desk. Roast also modernizes the conventional post-occupancy evaluation process of intermittent surveys and interviews. “We created a full web app to allow for the entire ecosystem of survey, [including its] creation, administration, and taking, and then the logging and analysis of that data,” says Roderick Bates, an associate and senior researcher at KieranTimberlake. “It allows for anyone to create and administer a survey—and removes excuses for not doing it.”
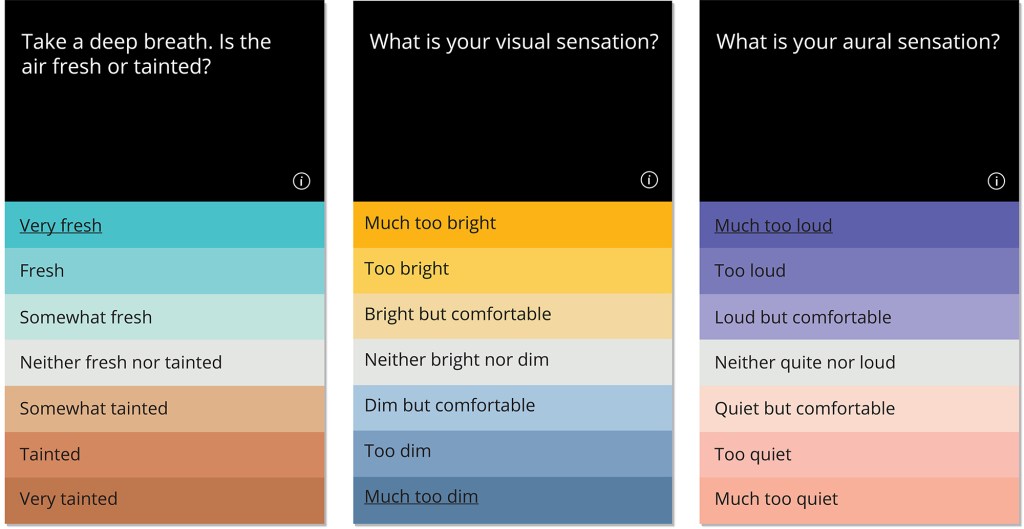
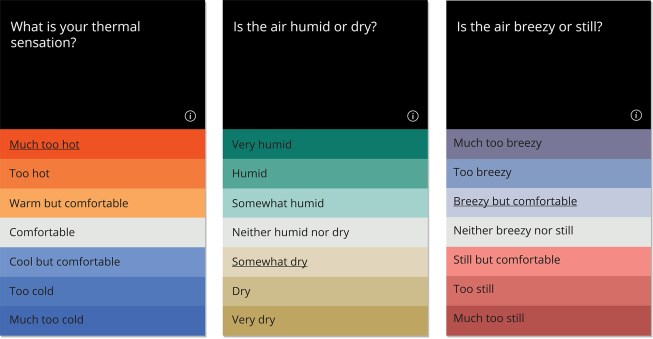
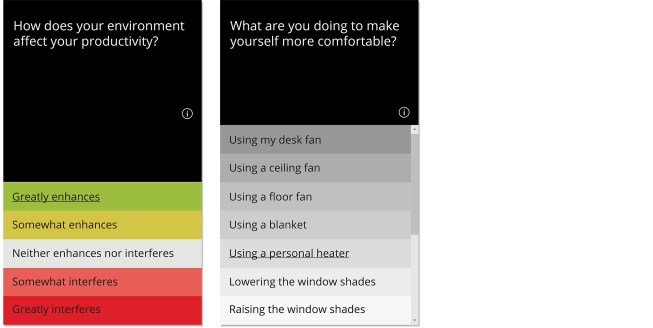
Survey administrators, Bates says, will be able to choose from a “series of predetermined questions that conform to peer-reviewed literature standards for what is appropriate question-asking in the context of thermal comfort” in addition to conditions such as air freshness, ambient light, noise, and worker productivity. To gather respondent location data, administrators will upload a DXF floorplan, a common CAD file format, with which to designate zones. Survey participants can then mark where they are on the screen. Administrators determine when and how frequently to distribute the survey, which is currently done via email—though KieranTimberlake is also exploring a texting option.
Roast can also query respondents on clothing value using predefined virtual closets to track correlations between wardrobe and comfort. “The administrator doesn’t necessarily see what they’re wearing, but what the thermal value of what they’re wearing,” Bates says, listing “summer-warm,” “winter-light,” and “winter-heavy” as example choices.
KT Innovations
Sample images from the Roast survey
What Roast notably does not track are the physical conditions of the space, a task served by KieranTimberlake’s Pointelist network. However, Bates says, “a lot of people see [Roast] as an absolutely necessary companion part to Pointelist. As to which comes first, it’s like [asking about] the chicken or the egg.”
Roast’s visual output delineates comfort on a floor plan collectively by zone and by person over time. With the data logged and stored in the cloud, architects can track multiple projects over time.
As its first beta-tester, KieranTimberlake used Roast to determine the set point of its mechanical cooling system, which it installed after enduring two of Philadelphia’s hot and muggy summers using passive-ventilation strategies. While many buildings are set to 72 F to 74 F in the cooling months, KieranTimberlake found that 80 percent of its staff is more comfortable at around 83 F. The difference translates to “money in our pockets, carbon not in the atmosphere, and energy saved,” Bates says.
Interestingly, Roast identified a cohort of employees who thrived in the cooler temperatures so the firm set aside a separate, colder space in which they can work away from their desk, as appropriate. The firm also found worth in collecting clothing-value information, which led to the relaxation of its dress code to enable more of its staff to feel comfortable.
Seeing the feedback drive change in the office is one way Bates believes Roast will combat the inevitable companion to surveys: survey fatigue. “People knew that if they didn’t respond, their opinion wouldn’t be factored into the office set point,” he says.
KT Innovations
Sample Roast survey cards
Though the app will indicate whether enough responses have been received for a survey to be viable, per the standard set by ASHRAE 55, Thermal Environmental Conditions for Human Occupancy, Faircloth wants Roast’s users to be cognizant of the information gathered. “Data collection practices is one that has to be scrutinized carefully by architects as we engage them,” she says. Though Roast, Pointelist, and Tally are tools that foster data collection and analysis, “each individual using the tool is also challenged to understand the question that they’re asking… . Our interpretation of [what is] statistically significant [is something] that we as a profession need to broadly address and up our game on.”
KieranTimberlake expects to launch an external beta test with a select group of “peers who have similar interests with merging thermal-comfort surveys with their own post-occupancy evaluation practices,” Faircloth says. These firms should be ready to dissect the app’s functionality, intellectual value, value to the profession, and user interface. As such, KieranTimberlake has yet to determine the cost of the service.
“Many of us in the profession want to make feedback essential to the future projects in which we engage,” Faircloth says. “This is a piece of activism on our part to make a type of analysis possible.”
Note: This story has been updated with a link to KieranTimberlake’s Roast survey app. Also, the temperature at which 80 percent of KieranTimberlake’s staff reported being comfortable was corrected as 83 F.