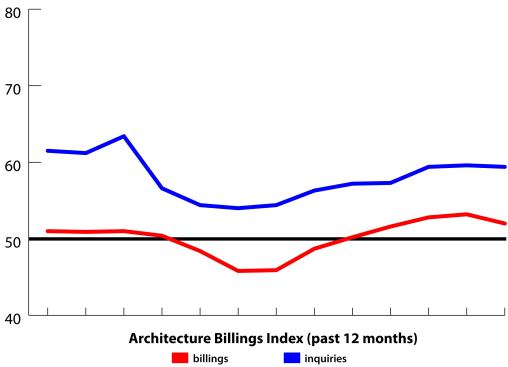
In December, the American Institute of Architects’ Architecture Billings Index marked its fifth consecutive month of growth in the demand for architectural design services. With a national score of 52.0, down slightly from November’s score of 53.2, the architecture industry is seeing continued strength leading into the winter months. The national score for project inquiries came in at 59.4—also down slightly, from 59.6—which represents the 47th straight month that project inquiries have shown growth. (A score above 50.0 means that demand is increasing.)
In 2010 and 2011, we saw this trend repeated: a five-month run of growth in billings that began in November and ended in March, followed by a lull in billings come late spring and summer. In 2012, billings began to grow in August. Today’s report shows that the speed of growth slowed a little last month, but not enough to bring the industry to contraction. If the trend continues through March, as it has the past two years, then that will mark eight straight months of growth. We will be watching to see if the upward swing in business continues or if the industry cools off again come spring. However, if you combine this data with the latest U.S. Department of Labor’s Bureau of Labor Statistics’ employment report that showed 3,800 architectural and engineering jobs were added to the economy in December, plus 2,400 in November and 1,500 in October, you can see some cause for hope that we might avoid what has become an annual spring contraction.
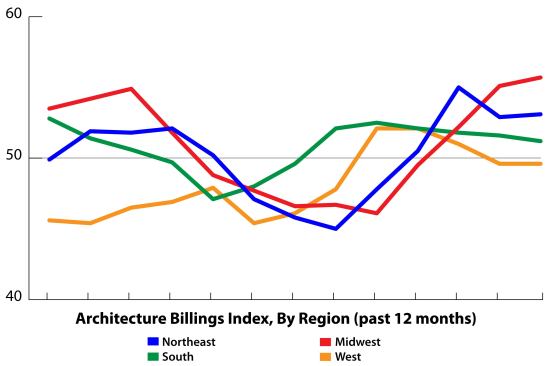
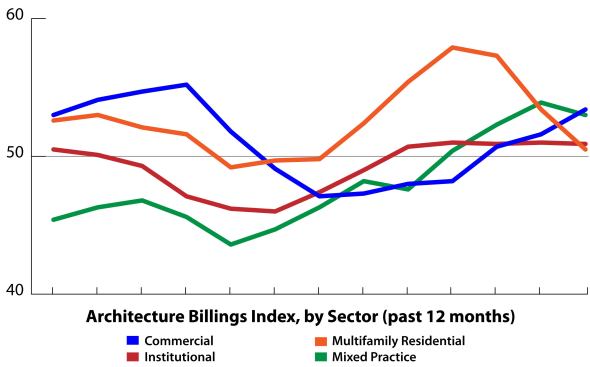
Three of the nation’s four regions also showed growth. (We saw the same trend in November.) And for the third consecutive month, all four of the industry’s sectors showed growth.
National Highlights:
Billings: At 52.0, the national score was down 1.2 points from November, but this still represents the fifth straight month of growth in architecture billings.
Inquiries: At 59.4, the score is down 0.2 points from November, but the increasing amount of inquiries into future projects has persisted since the end of the recession.
Regional Highlights:
Northeast: 53.1 is up slightly from November, and the region’s fourth straight month over 50.0.
Midwest: 55.7 is the highest score for the region since February 2006, and the third straight score above 50.0.
South: 51.2 is down slightly from November, but is the region’s sixth straight month over 50.0.
West: At 49.6, hovering at the breakeven point, this score remains unchanged from November.
Sector Highlights:
Multifamily Residential: 50.5 is the sixth straight month over 50.0. Moreover, this has been the strongest sector in terms of growth since the end of the recession, remaining above 50.0 in 18 of the past 24 months.
Mixed Practice: 53.0 is the fourth straight month above 50.0.
Commercial: 53.4 is the sector’s highest score since February, and the third straight month over 50.0. December was also the first month that the commercial sector was the industry’s strongest sector since April.
Institutional: 50.9 is the fifth straight month this sector came in over 50.0.


