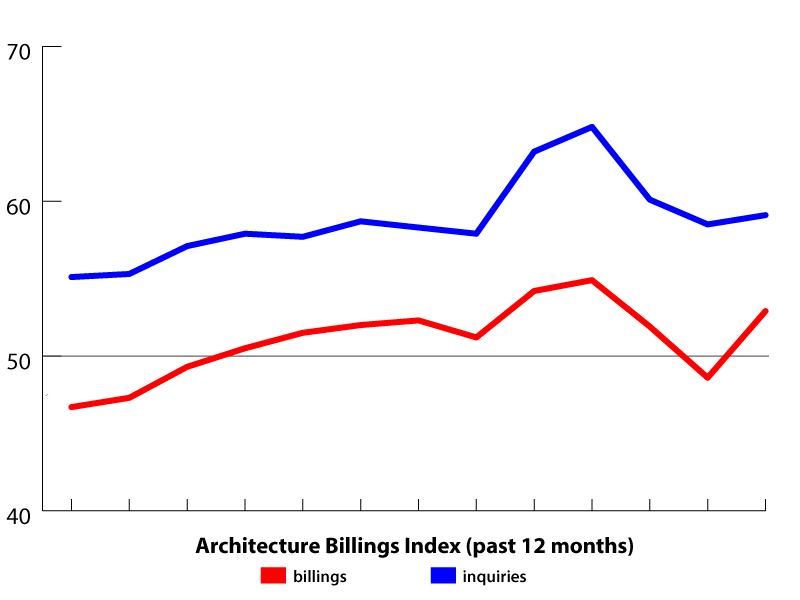
In May, the American Institute of Architects’ Architecture Billings Index marked a return to growth in the demand for architectural design services. April saw the first dip into negative territory for the index in nine months, which appears for now to have been an outlier. With a national score of 52.9, up more than four full points from April’s score of 48.6, the architecture industry saw a significant reversal of fortune. (A score above 50.0 in the index means that demand is increasing; below 50.0 means that demand is contracting.)
The score for project inquiries came in at 59.1, up from April’s revised figure of 58.5. Inquiries are still growing, and have been each month since the design and construction industry bottomed out after the 2008 financial crisis. This score is also inching its way back toward 60.
For May, the ABI’s data tracks well with the U.S. Department of Labor’s Bureau of Labor Statistics’ recent employment report. The BLS reported 175,000 jobs added to the economy in May, which was slightly better than expected, with the architectural and engineering services sector of the economy adding a sizable 4,900 jobs in May. This was the best result in all of 2013, almost twice the 2,700 architectural and engineering services jobs initially reported by the BLS in April. And prior to April, the industry had seen average growth of more than 2,000 jobs per month during each month except January.
Three each of the nation’s four regions and the industry’s four sectors showed growth in May. Only the Midwest and the Commercial sector continued to show contraction. All of the other sectors and half of the regions showed improved scores. (Remember, also, that the regional and sector scores are three-month moving averages, unlike the national score which is monthly—so these are going to show more gradual changes month to month.)
National Highlights
National: At 52.9, up from 48.6, the national billings score returns to growth after a month of contraction. For nine of the last 10 months, this score has been above 50.
Inquiries: At 59.1, this score is up from April’s 58.5. Inquiries into new projects continue to be strong, and have shown growth for more than four years.
Regional Highlights
Northeast: At 53.7, up from 52.3, this is the ninth straight month for the region above 50.
Midwest: At 47.5, down from 49.0, the Midwest region continued to contract.
South: At 50.9, down from 52.2, this was the 11th-straight month for the region above 50.
West: At 52.1, up from 51.7, this was the 10th-straight month for the region above 50.
Sector Highlights
Multifamily Residential: At 52.8, up from 52.6, this was the 13th-straight month for the sector above 50. The Multifamily Residential sector continues to be the consistent workhorse for the profession during the recovery. May’s score put the sector above 50 for 27 out of the last 36 months.
Commercial: At 47.5, down from an even-steven 50.0, this sector contracted for the first time in eight months.
Institutional: At 52.2, up from 51.3, this is the 10th-straight month above 50, a pretty remarkable feat given federal, state, and local budget cuts over the past year.
Mixed Practice: At 51.0, up from 50.4, this is the ninth-straight month for the sector above 50.


