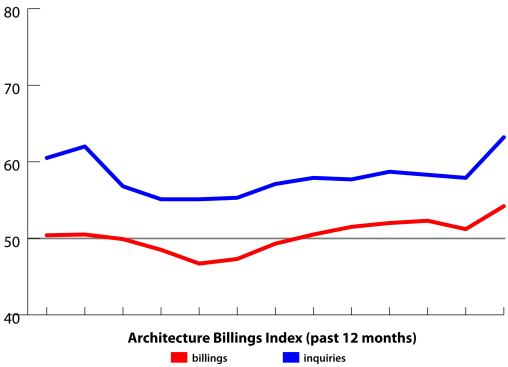
In January, the American Institute of Architects’ Architecture Billings Index marked its sixth consecutive month of growth in the demand for architectural design services. With a national score of 54.2, up significantly from December’s score of 51.2, the architecture industry is seeing continued strength as we begin to come out of the winter. (Each January, the AIA revises its previous year’s numbers. Last month, we reported the national billings score as 52.0, but the AIA has revised that number down to 51.2.)
The national score for project inquiries came in at 63.2, which is also up—significantly—from the AIA’s revised score of 57.9 in December. This represents the 48th straight month that project inquiries have shown growth. (A score above 50.0 means that demand is increasing.)
January was a good month for the architectural profession, possibly the best month since the beginning of the financial crisis and recession. The 54.2 score for billings is the highest score, meaning the fastest rate of growth, since November 2007. The 63.2 for project inquiries is the highest score since July 2007. The six-month run of billings scores above 50 is the longest such run since 2007.
We will still be watching to see if the upward swing in business continues or if the industry cools off again come spring, as it has the past couple of years. But the upward trends are hopeful. The AIA’s revised data even suggest that the past couple of years were worse that had been previously thought. Whereas the old data showed that there had been a five-month run of positive billings in the fall to spring in 2010 and 2011, the AIA new data suggest that the period from fall 2010 to spring 2011 only saw a two-month string of positive growth; during the same period one year later, the growth spurt lasted only four months. All of this makes the 2012–2013 run of good numbers even more impressive.
In addition, January’s ABI data contradict the U.S. Department of Labor’s Bureau of Labor Statistics’ January employment report. Two weeks ago, BLS reported that the economy lost 300 architectural and engineering services jobs in January, which seems contradictory to the AIA’s numbers that indicate an economic segment that is growing faster than it has in nearly six years. The AIA’s data does make sense as a logical extension of the BLS’s previously reported figures of 3,800 architectural and engineering jobs added to the economy in December, 2,400 in November, and 1,500 in October. The job surveys don’t always tell the full story, as National Association of Home Builders economist Robert Dietz told ARCHITECT back in December.
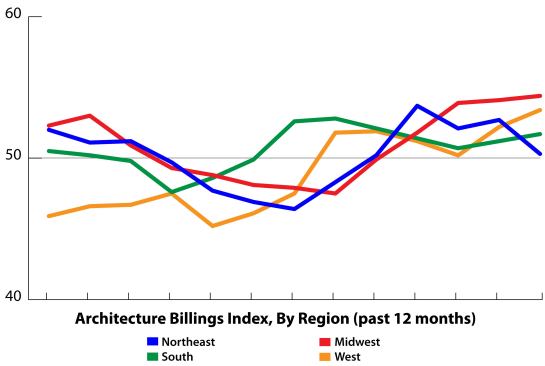
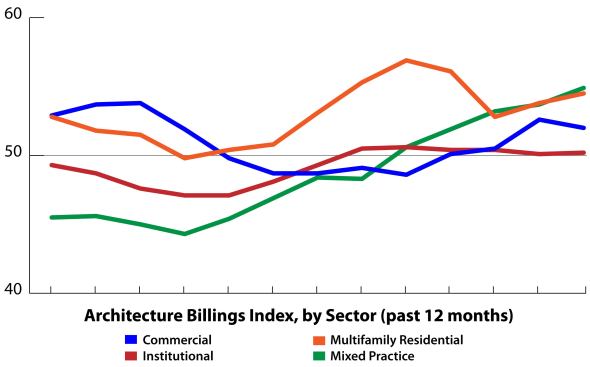
Also, all four of the nation’s four regions and all four of the industry’s sectors all also showed growth.
National Highlights:
Billings: At 54.2, this is the highest billings score since November 2007, and the sixth straight month of growth.
Inquiries: At 63.2, this is the highest score for project inquiries since July 2007. Inquiries have now been over 50 each month for 48 consecutive months.
Regional Highlights:
Northeast: At 50.3, this is down slightly from December, but is the fifth straight month above 50.
Midwest: At 54.5, this is the highest score since March 2006, and the fourth straight month above 50.
South: At 51.7, this is up from December and the seventh straight month above 50.
West: At 53.4, this is the highest since August 2007 and the sixth straight month above 50.
Sector Highlights:
Multifamily Residential: At 54.5, this is the ninth straight month above 50, and the sector has been above 50 for 15 of the past 16 months. Multifamily has consistently been the most productive sector for the past few years.
Mixed Practice: At 54.9, this is the highest score since November 2007, and the fifth straight month above 50.
Commercial: At 52.0, this is the fourth straight month above 50.
Institutional: At 50.2, this is the sixth straight month above 50.


