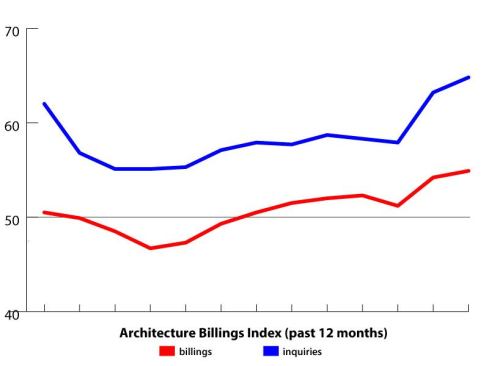
In February, the American Institute of Architects’ Architecture Billings Index marked its seventh consecutive month of growth in the demand for architectural design services. With a national score of 54.9, up from January’s score of 54.2, the architecture industry is seeing continued strength and a higher rate of growth of billings than it has seen since the bubble burst five years ago. (A score above 50.0 in the index means that demand is increasing.)
The score for project inquiries came in at 64.8, which is also up from the January score of 63.2. Project inquiries have now been growing for more than four years straight, after a shaky 2008.
February was another good month for the architectural profession, which has been rolling for half a year. The 54.9 score for billings is the highest score, meaning the fastest rate of growth, since November 2007, which also saw a score of 54.9. The seven-month run of billings scores above 50 is the longest such run since 2007. The 64.8 for project inquiries is the highest score since January 2007.
In addition, February’s ABI data match the U.S. Department of Labor’s Bureau of Labor Statistics’ February employment report. Two weeks ago, the BLS reported that the economy added 3,100 architectural and engineering services jobs in February. January saw a small dip of 300 jobs in the segment, but before that, there had been 3,800 architectural and engineering jobs added to the economy in December, 2,400 in November, and 1,500 in October. The 3,100 jobs added in February is closer to the trend line than the 300 lost, which now appears to have been an aberration.
Also, all four of the nation’s four regions and all four of the industry’s sectors also showed growth, as they have for five straight months. One has to go back to the summer of 2007 or before to see a positive streak like that across the entire design and construction industry nationwide.
National Highlights
Billings: At 54.9, this is the highest billings score since November 2007, and the seventh straight month of growth.
Inquiries: At 64.8, this is the highest score for project inquiries since January 2007.
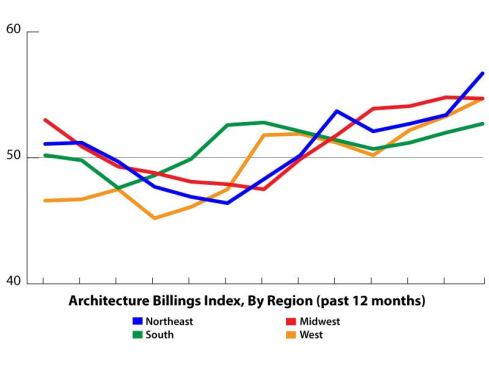
Regional Highlights
Northeast: At 56.7, this is the highest score since December 2007, and is the sixth straight month above 50.
Midwest: At 54.7, this is down a tenth of a point from last month, but it is the fifth straight month above 50.
South: At 52.7, this is the highest score since August, and it is the eighth straight month above 50.
West: At 54.7, this is the highest score since July 2007, and it is the seventh straight month above 50.
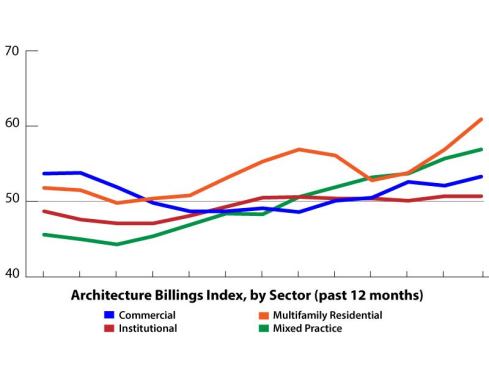
Sector Highlights
Multifamily Residential: At 60.9, this is highest score since October 2004. It is also the 10th straight month above 50, and the sector has been above 50 for 16 of the past 17 months, as well as 24 of the past 30 months and 19 of the past 24 months. This sector has been by far the most productive since the real estate bubble burst and the financial crisis devastated the economy.
Mixed Practice: At 56.9, this is the highest score since July 2007, and it is the sixth straight month above 50.
Commercial: At 53.3, this is the highest score since March, and it is the fifth straight month above 50.
Institutional: At 50.7, this is the same as last month, and it is the seventh straight month above 50.


