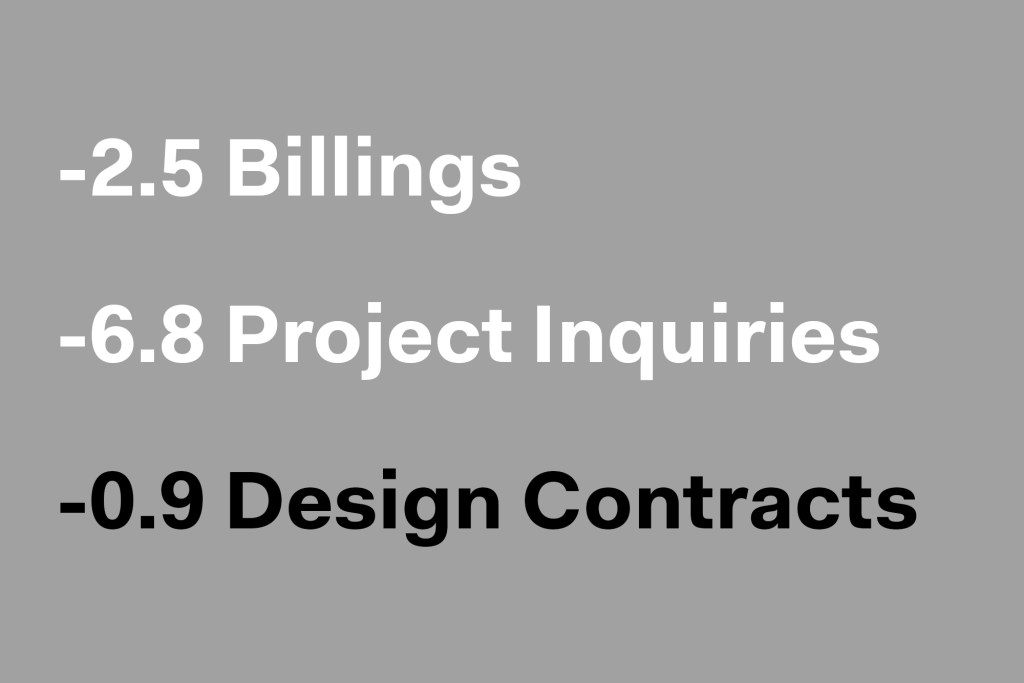
AIA’s monthly Architecture Billings Index remained positive in July, coming in at 54.6, which is 2.5 points lower than June’s ABI of 57.1. The ABI is a leading economic indicator of construction activity in the U.S. and reflects a nine- to 12-month lead time between architecture billings and construction spending nationally, regionally, and by project type. A score above 50 represents an increase in billings from the previous month, while a score below 50 represents a contraction.
The design contracts score remained stable at 58.0 in July, falling 0.9 point from June’s score of 58.9. New project inquiries remained strong at 65.0, falling 6.8 points from June’s high score of 71.8. “In prior business cycles, architecture firms generally saw their project work soften quickly and then recover slowly,” said AIA chief economist, Kermit Baker, Hon. AIA. “So the strength of this recovery is unprecedented. Firm leaders who have leaned into this economic upturn by reinvesting in their firms by hiring staff and upgrading their technology will likely have a better year than those that anticipated a slower recovery.”
The month-to-month change in scores for regional billings—which, unlike the national score, are calculated as three-month moving averages—remained in positive territory in June, although three of the four regional billing scores lost ground. Billings in the Midwest fell 3.7 points to a score of 58.3, while billings in the West decreased 3.7 points to a score of 56.0. Billings in the South fell 2.7 points to a score of 54.6, and billings in the Northeast rose 0.9 point to a score of 54.1.
Billings scores also remained in positive territory, although all four scores decreased from their June values. The commercial/industrial sector fell 2.6 points to a score of 58.4; the institutional sector decreased 1.9 points to a score of 55.4. The multifamily residential score fell 3.2 points to a score of 54.7, and the mixed practice sector fell 2.0 points to a score of 54.4. Like the regional billings scores, sector billings scores are also calculated as three-month moving averages.


