This story was originally published in Builder.
Many sellers across New York City cut prices on their homes this February as winter brought a chill to the sales market, according to the monthly StreetEasy report on the housing markets in Manhattan, Brooklyn and Queens.
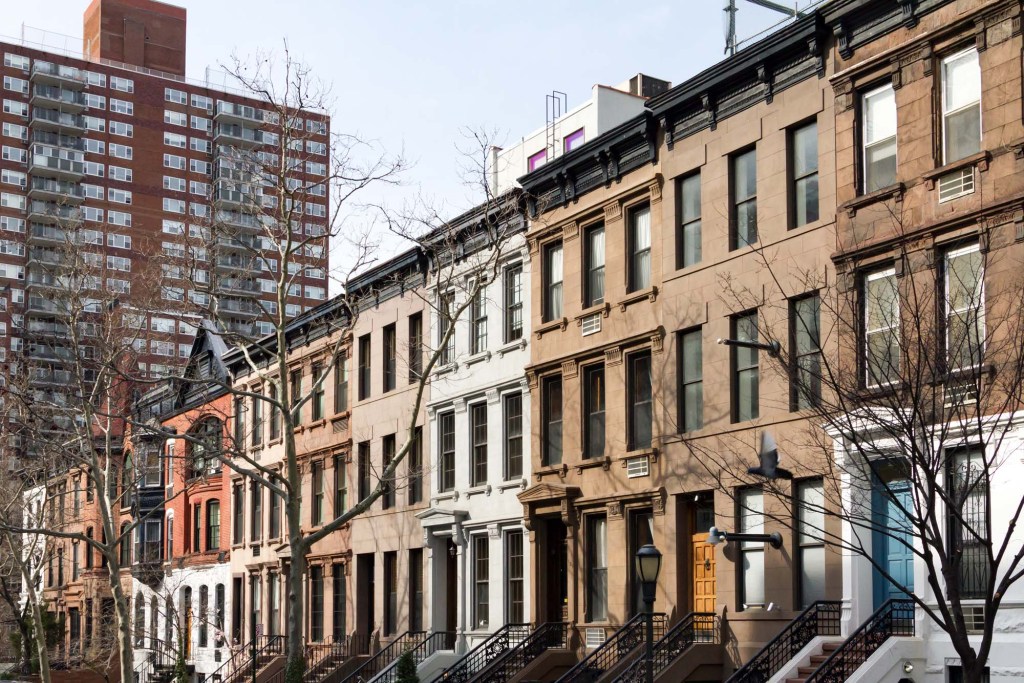
In Manhattan, more than one in ten homes had their prices cut, and inventory increased by 11.7% from last year. With the share of price cuts and inventory levels high across the borough, prices cooled, too. The StreetEasy Manhattan Price Index dropped 4.3% to $1,119,183, its lowest level since July 2015.
Manhattan homes spent a median of 117 days on the market — up 27 days year-over-year, and the highest level in seven years. This trend appeared in all areas and price points across the borough. Downtown Manhattan saw the largest increase in median days on market – up 31 from last year, to 117 days total.
“With a strong economy and home-shopping season right around the corner, plenty of New Yorkers are well-positioned to buy this spring. However, many are willing to walk away from deals that just aren’t financially attractive and continue renting instead— creating a market poised to punish sellers who don’t price their homes sensibly,” said StreetEasy Senior Economist Grant Long. “When the inevitable wave of new inventory hits the market this spring, interested buyers should expect to see an uptick in price cuts as the market forces ambitious sellers to accept reality.”
February 2019 Key Findings — Manhattan
- Home prices dropped boroughwide. The StreetEasy Manhattan Price Index fell 4.3% to $1,119,183. Prices dropped in all five submarkets, with the Upper West Side seeing the most significant decrease — down 4.4% to $1,106,947, its lowest level since June 2015.
- Homes took a month longer to sell. Manhattan homes spent a median of 117 days on the market – — up 27 days year-over-year. In February, homes in the Upper East Side submarket spent the most time on market at 123 days – 25 days longer than last year.
- Sales inventory remained high. The total number of homes for sale in Manhattan increased 11.7% year-over-year. Inventory grew across the borough, with Upper Manhattan gaining the largest relative share of new inventory at 18.4%.
- Recorded sales declined. There were 2.2% fewer home sales in February in the borough. Sales decreased in all five submarkets, led by Downtown Manhattan, where there were 7.9% fewer sales.
- More than one in ten homes had their price cut. 11% of homes in Manhattan saw a price cut in February – a slight increase of 0.1 percentage points year-over-year. Upper Manhattan saw the most significant annual jump in the share of price cuts – up 1.3 percentage points to 10.3%.
- Rents continued to rise. The StreetEasy Manhattan Rent Index increased 2.5% annually, reaching $3,209. Downtown Manhattan rents reached their highest level ever — up 2.5% to $3,730.
February 2019 Key Findings — Brooklyn
- Prices remained the same. The StreetEasy Brooklyn Price Index increased by just 0.6% to $713,513. Prices rose across the borough, except in East Brooklyn, where they dropped 3.1% to $615,464.
- Sales inventory increased significantly. Inventory in Brooklyn rose 21.9% from last year. There were some 150 more homes available for sale in Northwest Brooklyn this February than last year — a 27.9% increase.
- Homes took two weeks longer to sell. The median days on market increased to 90 days in Brooklyn, up 15 days from last year. Homes in Prospect Park spent over two months longer on the market — up 70 days to 101 total days.
- There were more price cuts. Borough-wide, the share of price cuts increased by 4.2 percentage points to 11.6%. East Brooklyn had the largest spike in price cuts compared to last year – up 5.7 percentage points to 11.8%.
- Rents in North Brooklyn decreased slightly. Despite the cancellation of the L train shutdown, rents in North Brooklyn remained relatively stagnant at $3,046 — a 0.9% decrease from last year. Boroughwide, the StreetEasy Brooklyn Rent Index was up 1.8% to $2,593.
- 1 in 10 rentals advertised concessions. The share of rentals advertising concessions dropped by 7.1 percentage points year-over-year, down to 9.7% boroughwide.
February 2019 Key Findings — Queens
- Price growth continued to slow. The StreetEasy Queens Price Index increased 4.0% annually, reaching $523,592. While prices are still increasing in the borough, growth has slowed compared to the high levels seen in 2018.
- Sales inventory increased the most of any borough. Queens saw the most significant jump in sales inventory of the three boroughs tracked — up 26.5% year-over-year.
- Homes sold the fastest. Of the three boroughs, homes in Queens moved off the market the fastest at a median of 67 days – one day faster than last year.
- The share of price cuts increased. The share of homes with a price cut increased to 8.8% in the borough – up 3.1 percentage points year-over-year.
- Rents increased steadily. The StreetEasy Queens Rent Index reached $2,163 — up 2.4% year-over-year. Northwest Queens had the largest increase in rents, up 2.3% to $2,254.
This story was originally published in Builder.


