This story was originally published in Builder.
It’s got the wonks to wondering and it’s one of demographics’ mysteries of the moment.
Declining American birth rates are not news, but the latest–provisional—data on fertility from the National Center for Health Statistics came to light as somewhat of a shocker, especially as tidings of jobs, employment trends, and wages evidence a robust economy, full of momentum.
In 2017, not only were birth rates down a third consecutive year, they fell dramatically—to a level lower than any year since 1987. Fortune writer David Meyer reports:
The U.S. last year saw its lowest number of births in three decades—a total of 3,853,472, which was down 2 percent from 2016.
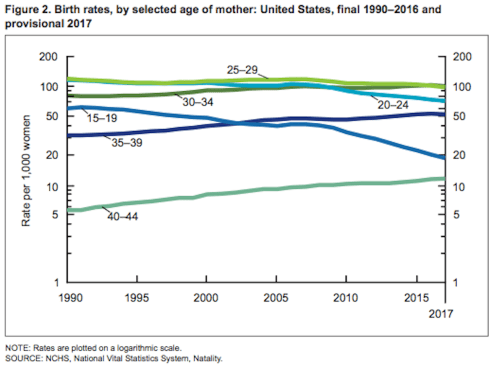
This is the third annual decline in a row, and 2017 also saw a record low fertility rate of 60.2 births per 1,000 women aged 15-44. The only group to see birth rates rise was women in their early 40s—the birth rate for teenagers was down a whopping 7 percent, meaning the teen birthrate is now down 55 percent from 2007.
And what’s more, they surprisingly slipped downward in the “over 25-year-old” age group—gaining only in the plus-40-year-old age segment. Further, fertility rates clocked in at red-flag levels compared with a “replacement level” benchmark that starts experts, analysts, and economists to fretting about the nation’s future capacity to sustain itself in a regenerative way. Replacement level fertility rates were last recorded in 1971, per the Center for Disease Control.
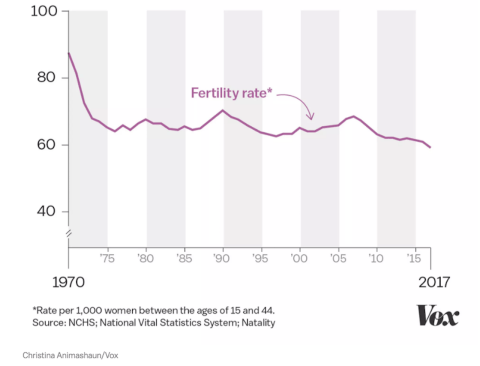
This commentary from Vox correspondent Julia Belluz zeroes in on the worrisome data point:
The fertility rate is an important measure of a country’s well-being. When it’s too low, countries worry that in the long term they may not have enough healthy, young workers to keep productivity up and the economy humming. Meanwhile, a birthrate that’s too high can be a drag on resources.
The “replacement” fertility rate of 2.1—enough to renew the population—is typically viewed as the optimal level for stability. But in 2017, the total fertility rate, or number of births each woman is expected to have in her childbearing years, dropped to 1.76 in the US.
Perhaps what’s most mystifying, though, is that good times are when America’s normally seen “baby booms,” not “baby busts.” Speculation and conjecture about the disconnect between fertility and birth rate patterns considered typical and economic recovery cycles is rampant.
“It could be that the new generation of millennial women is delaying having children even longer than the women who came before them, as prime childbearing years are also critical years for advancing in a career. A recent study shows that the marital pay gap that springs up after a first child is born typically does not close if the birth happens between age 25 and 35.”
Is the trend a blip or a structural change? Is it culture-driven or explainable as an economic after-effect? Neither are there answers nor a definitive time horizon for those answers to become clear. What’s evident, however, is that if the pattern continues trouble lies ahead for many business sectors, including housing. Wall Street Journal staffer Janet Adamy reports:
This dearth of births could exacerbate the problems of America’s aging population. Many baby boomers are in or are near retirement, leaving a smaller share of young workers to pay into Social Security and Medicare. That is creating a funding imbalance that strains the social safety net that supports the elderly.
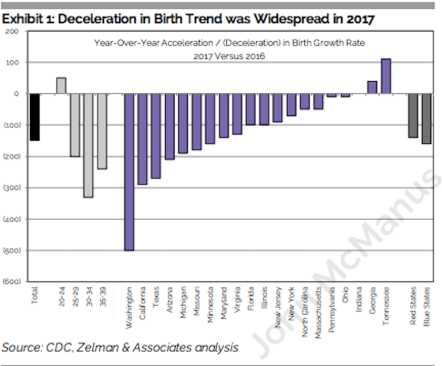
So, while the noise-level picks up volume in the wake of last month’s data release, calm minds prevail. Here, the team at Zelman & Associates acknowledges that the statistical headline is concerning, but that when you step back and get some distance from framing and recency biases, it’s a far cry from time to panic. In the latest edition of the twice-monthly The Z Report (which you can access for a free trial here), the analysis “Is Trump to Blame for Lack of a Baby Bump?” notes:
Generally, births tend to contract around recessionary episodes and accelerate during economic recoveries, but it is not without annual volatility within the cycle as we have found virtually no correlation in growth of “good” births and the national employment rate. For example, growth in births for this age cohort ranged from 0.6-2.7% during 2002-06, and from 0.1-2.9 percent during 1996-2000.
Thus, volatility is not new, but we certainly would not have bet on 2017 shifting to a sizeable decline given the strength in entry-level housing. We are optimistic that the 2017 decline will prove to be one of these aberrations versus a structural shift and are at least encouraged by improving trends through the year, with 4Q17 flat year oover year for 25 and older women versus down 2.0 percent in 1Q17.
Silver linings? There are two. One is that demographics are glacial and national, while your business is all about now and tomorrow, and is hyper local.
The second is that big data behavioral and engagement tools can help your team navigate through such broad-swath people patterns and make an opportunity of what’s a big risk to the rest of your competitors.
This story was originally published in Builder.


