
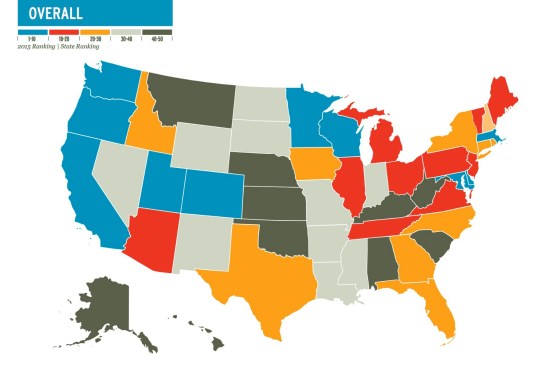
Every year the League of American Bicyclists sends their Bicycle Friendly State (BFS℠) questionnaire to the Bicycle Coordinator in every state, asking them to grade their state on a point scale in five categories: Legislation & Enforcement, Policies & Programs, Infrastructure & Funding, Education & Encouragement, and Evaluation & Planning. Once all questionnaires are submitted and fact-checked, the league develops the ranking and report cards based on weighted percentage of total available points, with input from state advocacy organizations.
Specifically, the five categories measure the following:
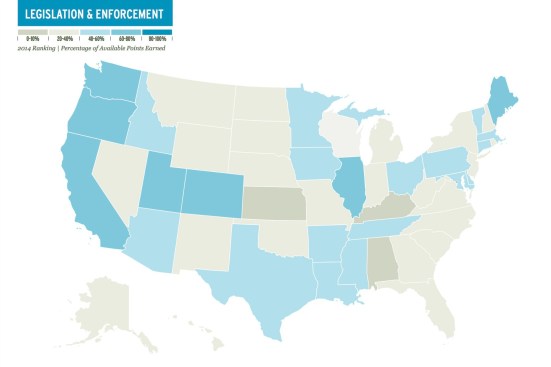
- Legislation & Enforcement: Basic laws and regulations that govern bicycling in the state–the type of training law enforcement receive to ensure protection of cyclists’ rights and saftey, motorist responsibilities, cyclist regulations like how to signal turns and where in the road they can bike.
- Programs & Policies: What state agency requirements accommodate cyclists–plans/agreements for bike trails, Complete Streets policy, how much agency staff time is dedicated to bicycling, whether bicycling is included in the state’s carbon-reduction plan.
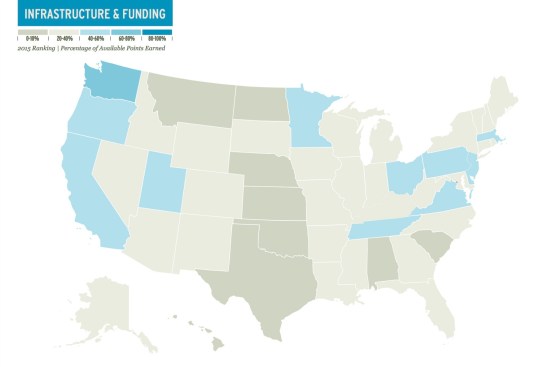
- Infrastructure & Funding: The questionnaire works to collect data on specific performance measurements in this section, like the amount of facilities/amount of state revenue committed to bicycle and pedestrian projects and programs, the percentage of state highways with shoulders, miles of bike trails, whether the bicycle route system is signed/marked and part of the US Bike Route system.
- Education & Encouragement: How states encourage more and better bicycling via state and local advocacy groups, how the state educates drivers on the road about cycling (like Share the Road campaigns, or questions about cyclists’ rights in state driver license exams).
- Evaluation & Planning: This section measures results of bicycle/car crash rates, bike commuting rates, inclusion of bicyclists in the highway safety plan, outdoor recreation plan, and/or bicycle transportation plan, and how bicycling is incorporated in yearly budget planning.
For the eighth year in a row since the Bicycle Friendly State questionnaire started, Washington received the no. 1 ranking, while Massachusetts made great gains in their Policies & Programs, and Education & Encouragement category scores, lifting them from no. 10 in 2014 to no. 4 this year.
Every state has an individual report card outlining their regional ranking and individual category scores, as well as detailed feedback about what the state is currently doing to advocate for cyclists, and how they can improve their programs (and overall score) in the coming year.
Top 15 Bike Friendly States:
- Washington – View report card >>
- Minnesota – View report card >>
- Delaware – View report card >>
- Massachusetts – View report card >>
- Utah – View report card >>
- Oregon – View report card >>
- Colorado – View report card >>
- California – View report card >>
- Wisconsin – View report card >>
- Maryland – View report card >>
- New Jersey – View report card >>
- Pennsylvania – View report card >>
- Virginia – View report card >>
- Illinois – View report card >>
- Maine – View report card >>


League of American Bicyclists
In this gallery you can view maps created by the League of American Bicylists that heat map the amount of points each state received overall, and in each of the five categories. As you can see in the first image which heat maps bike-friendly states by their overall scores, the majority of top-ranked states are in the western region of the United States (four of the top 10).
For more information on the ranking, visit the League of American Cyclists’ release >>