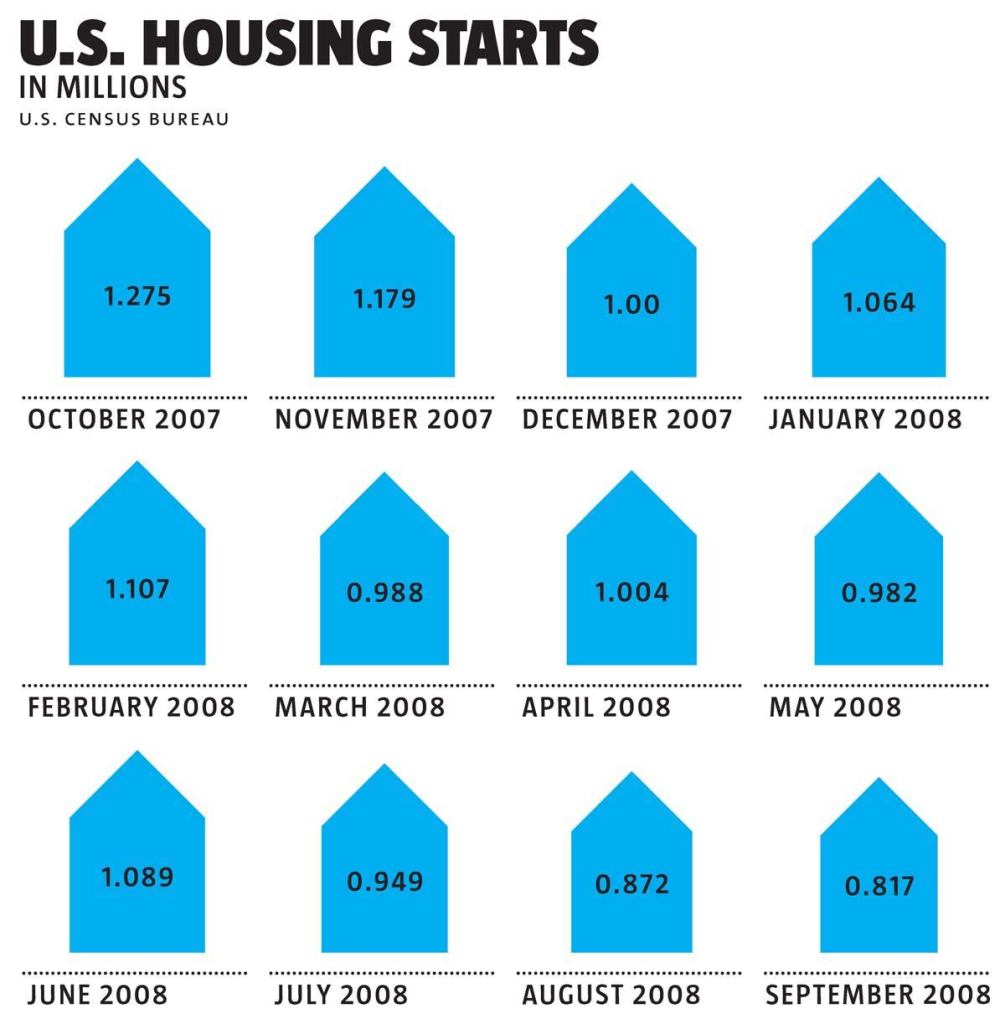
The economist John Kenneth Galbraith once said of his field of study, “On few topics is an American audience so practiced in turning off its ears and minds.” What a difference a year makes—specifically, fourth quarter 2007 to third quarter 2008, As represented by the six economic indicators illustrated here. (dismal science, indeed: if a 1.6 percentage point increase in unemployment doesn’t seem like much, understand that it translates to about 2.4 million lost jobs.) By the time all hell broke loose in September, pretty much everyone in the U.S. was paying close attention. Things haven’t gotten any better since, and the outlook for the months ahead is equally bleak. As a result, it’s not likely any of us will stop being vigilant—even when things do turn around (and they will).
U.S. Housing Starts
(in millions)
Dow Jones Industrial Average
Architecture Billings Index
(number in house indicates deviation from 50)
U.S. Unemployment
Consumer Confidence
(1985 = 100)
Price of Crude Oil
(in U.S. dollars per barrel)


