
This story was originally published on ARCHITECT’s sister site, Builder.
Inflation, or the general upward movement in prices of goods and services in an economy, is a core issue today.
The most recent national data reported by the Bureau of Labor Statistics (BLS) shows inflation is still up 6.4% compared with last year. This is down from the 2022 annual average of 8% and supports the idea that inflation is likely past peak but still unhealthily high. While the data is generally trending in the right direction, inflation levels need to get closer to the Federal Reserve’s target of an average of 2%.
In housing, we often say there is no national market. Rather, the national trends are just a roll-up of local markets, all of which have different drivers and nuances. Inflation is the same. While inflation can be, and is, reported nationally, there are clear differences by market that are worth exploring.
The table below shows the 10 metro areas (note: BLS collects this data for only 23 select metros) with the highest year-over-year inflation from 2021 to 2022:
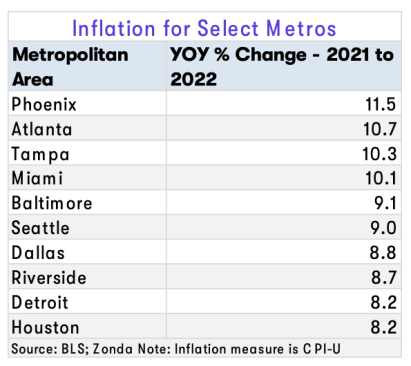
Markets with abnormally high inflation are spread across the country: in areas with high levels of migration, like Phoenix, but also markets where relocation activity has been less of a driver of growth, like Detroit.
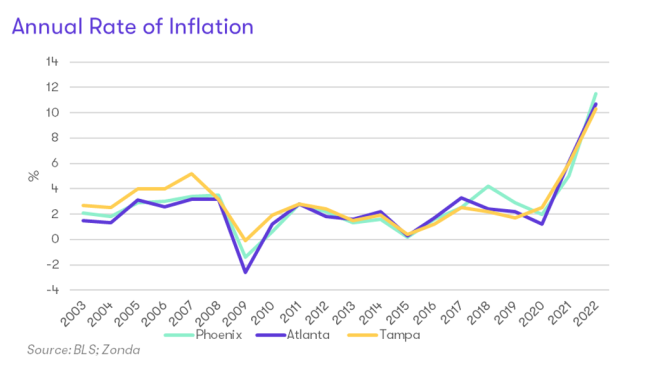
Phoenix, Atlanta, and Tampa, Florida, top the list for the highest levels of inflation over the past year, averaging 10%-plus growth year over year. However, the recent bout of inflation is a historical anomaly. For the nearly 20 years leading up to the pandemic, the inflation rate in these markets remained close to the Fed’s target. For example, Phoenix’s inflation ran at 2.1% per year on average, Atlanta at 1.8%, and Tampa at 2.4%. Even as recently as 2020, inflation was at 2% on an annual basis in Phoenix, 1.2% in Atlanta, and 2.5% in Tampa.
Inflation is still elevated in these metros, but we are seeing an improvement from the highs in July and August 2022 when the rate in Phoenix was 13% year over year, 11.7% in Atlanta, and 11.2% in Tampa.
While inflation levels across the U.S. have been high over the past few years given increased consumer savings, supply chain disruptions, and a general supply/demand imbalance, part of the increase seen in Phoenix, Atlanta, and Tampa can be attributed to these markets being “winners” of the changes brought on by the pandemic. As the metros experienced rapid growth in employment and migration, they also experienced rising home prices and a notable increase in the cost of goods and services locally.
Consider employment. All three of the metros with the highest level of inflation also are growing economies with a diverse labor force. In fact, Atlanta is the seventh largest economy in the U.S. based on total non-farm employment, Phoenix is No. 12, and Tampa is No. 19.
- Headquarter haven in Atlanta. Atlanta ranks third in the country for having the most Fortune 500 headquarters, behind New York City and Houston. Employers include The Home Depot, UPS, Coca-Cola, and Delta Airlines. At Zonda, we like to track high-income employees (Zonda defines high-income jobs as those in the financial activities, professional and business services, and information sectors) given that they have a higher propensity to be or become homeowners. Atlanta has the fifth highest share of high-income jobs to total jobs among U.S. metros at 30.5%. This is up from 27.6% in 2010. (We considered only those metropolitan areas with populations greater than 750,000 for the high-income jobs analysis.)
- Notable high-income growth in Tampa. Tampa’s economy is diverse, led by strong employment in trade, transportation, and utilities; professional and business services; and education and health services. In Tampa, 29.9% of jobs are considered high-income, ranking eighth among large metros. This was up from 26.2% in 2010, showing almost a 4-percentage point gain over the past decade.
- An evolving economy in Phoenix. Arizona recently ranked fourth in Best States For Business as state officials continue to work toward attracting and retaining new companies and industries. Phoenix, in particular, has notably diversified compared with 20 years ago with growth in semiconductors and tech among other sectors. Phoenix ranks No. 15 for high-income share at 27.8% of jobs, up from 26% in 2010.
The growing labor market has been supported by increased migration; Phoenix and Tampa land in the top five for domestic net migration among major metros based on the most recent data from the U.S. Census Bureau, and Atlanta ranks No. 17.
Take Phoenix, for example: 37.5% of searches for homes in Phoenix on Realtor.com come from out of state, with an additional 2.4% from international viewers. Zonda highlighted the attractiveness of Phoenix in its Baby Chaser blog, which discussed the relatively attractive climate, variety of recreational activities, and better housing affordability than some other markets across the country.
Increased levels of migration, especially when combined with strong and growing economies, is welcome news for market resilience. However, it also comes at a cost—increased competition for local resources. The housing market is a good example. With the recent increase in mortgage rates and home prices, Zonda calculates that monthly mortgage payments are up 55% from January 2022 to January 2023 in Tampa, 52% in Atlanta, and 43% in Phoenix.
On top of broader economic inflation, the higher shelter costs are putting pressure on household budgets, particularly for those trying to gain access to homeownership. Zonda recently highlighted how certain buyers (first-time, low-income) are particularly hurt by inflationary pressures.
An interesting dynamic, though, is that even with the increased levels of inflation and shelter costs, the three markets considered here have only slightly higher costs of living than the national average, according to AdvisorSmith’s latest data. The national average is indexed to 100, with Atlanta coming in at 100.3 (0.3% more expensive than the national average), Tampa at 101.4, and Phoenix at 104.3. For comparison, San Francisco had the highest level in the nation at 178.0, Los Angeles came in at 140.6, and New York City at 128.0.
Ultimately, inflation occurs when too much money chases too few goods. Inflation in the U.S. has been driven by a multitude of factors over the past couple of years, and, on a metro level, part of this pressure has been exacerbated due to migration, a strong labor market, and the demand for housing.
In order to get inflation under control, the Federal Reserve has stated it will continue its current tightening program until it feels inflation is sufficiently back to more healthy levels. We’ll be tracking how effective policy is at the national level, but we advise keeping up with your local markets as well.
This story was originally published on ARCHITECT’s sister site, Builder.


