This story was originally published in Builder.
Which statement is true?
- Homeownership rates are up.
- Homeownership rates are down.
- Homeownership rates are flat.
Your answer matters. After all, depending on whether you pick 1, 2, or 3 as the true statement probably says a lot about where you think business opportunity in the housing market is heading.
But what if all three statements is factually correct?
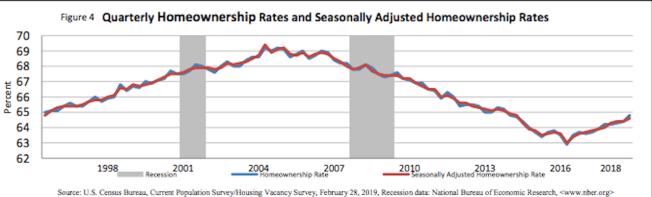
Take a look at this chart on homeownership rates from the U.S. Census. Now, using a straight edge or a steady hand draw a line from left to right, starting with the verticle axis at the just-under-65% mark, straight across to the right-hand verticle axis at the just-under-65% mark.
Now answer the question, which statement is true.
- Homeownership rates are up.
- Homeownership rates are down.
- Homeownership rates are flat.
Here’s what demographer and editorial director of New Strategist Press, Cheryl Russell, says about what the data is telling us. As you can see from the chart, they’re up from their post-Great Recession trough of 63.4%, but way down from their pre-recession peak in 2004 of 69%. Still, Russell writes:
Perhaps comparing today’s homeownership rate with the pumped-up rates of the housing bubble does not provide the necessary perspective. It might be more instructive to compare the 2018 rate to homeownership rates prior to the housing bubble. During the 30-year span from 1970 to 2000, the homeownership rate ranged from a low of 63.8 percent in 1988 to a high of 66.8 percent in 1999. The average rate during the time period was 64.7 percent, almost identical to the 64.4 percent of 2018. This exercise suggests, then, that today’s homeownership rate is not the new normal. It’s the old normal.
Now, in some respects those with vested and invested interests in new and existing for-sale residential properties can take a view that flat is the new up. That’s because the reversion to a homeownership norm of just shy of 65% is against a growing total universe of people and households. Jonathan Spader, a senior researcher at the Joint Center for Housing Studies, writes this about what household growth of 12.2 million households during the 2018-2028 decade ahead should mean for total homeownership.
The paper’s “base-case scenario,” which applies constant 2018 homeownership rates by age, race/ethnicity, and family type to the new projected household counts, implies that almost two-thirds of the total growth in households would be among homeowners (Figure 1). Specifically, there would be an increase of 8.0 million homeowner households and 4.2 million renter households by 2028, and 13.6 million homeowner households and 8.1 million renter households by 2038. Moreover, the projected changes in the demographic composition of U.S. households by age, race/ethnicity, and family type will largely have offsetting impacts on the homeownership rate, which would rise from 64.3 percent in 2018 to 64.5 percent in 2028 and then decline slightly to 64.1 percent by 2038 (Figure 2).
Now, these scenarios provide a backdrop that, at best, broadly characterizes an operating environment. They’re not strategic metrics, nor business tools by any means. In a sense, the business tool for a home building company strategist and operator is to “de-average” both key performance indicators and certainly externalities like homeownership rates.
JCHS researcher Spader’s baseline, high, and low scenarios–for either 10.1 million new homeowners between now and 2028 on the high side, or 6 million added homeowners during the same time period on the low side–may be taken as good, bad, or indifferent news relative to total residential investment in absolute demand. And truly, one can not infer in either of the three trajectories a “rising-tide-lifts-all-boats” constructive narrative for any single home builder in the next decade or so. Still, projections being what they are, they affirm time-tested assumptions relative to business success in new residential construction and development.
Like, for instance, “there are no bad deals in residential real estate, only bad timing.”
Spader’s commentary, its assertions, caveats, and disclaimers, all sound authoritative and evidence-supported. How can you argue with a statement like this?
In the near term, the homeownership rate’s actual trajectory will likely depend on the occurrence and timing of broader changes in the macroeconomy. Over the longer-term, the trajectory of the homeownership rate will be influenced by a larger set of factors related to households’ demand for housing as a place to live, their demand for the investment attributes of homeownership, any constraints on their ability to access mortgage credit, and the number of homes that are for sale.
At the macro level, demographics can probably work as a force of challenge to economic growth and business success, but by themselves, household patterns do not, or have they ever, account for a business’s reason for success.
You and your team have one homeownership rate to focus on and impact: the homeownership rate of people who are willing, able, and, potentially, desirous of owning one of your new homes, and letting you know as much with an earnest money deposit.
Chances are that person or couple or family–whereever they are on their current journey toward owning a home–are encountering pain, aggravation, frustration, and friction on their way through the process. Home by home, community by community, you can lessen that pain, reduce that friction, and increase your own firm’s conversion rate.
Happy Spring! The heat is on.
This story was originally published in Builder.


